

Put simply, what-if scenario analysis is a way of understanding how changes in one thing affect another.
To explain what this means, let's go straight to an example.
Let's say you sell bread at a market. You charge $2 per loaf of bread, and you sell 100 loafs a day. An example of what-if analysis would be to ask: what would happen to my revenue if I charged more for each loaf of bread?
In the simple case, where the volume of bread sold doesn't depend on the price of the bread, the analysis is very easy. An X% rise in the price per loaf will lead to an X% increase in sales.
But let's imagine the situation is a bit more complex, and that the amount of bread you sell does depend on the price you charge. Perhaps you try changing your price levels to various different points, and you notice a pattern emerge:
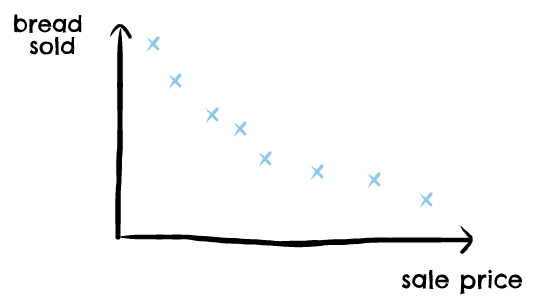
Perhaps you're a mathematically-inclined bread salesperson, and you realise that you can fit an equation quite nicely onto your data points:

The above gives us a way to understand how the volume of bread sold relates to the price per loaf. Now that we have this understanding, we can go back to our original question and answer how revenue changes depending on the price you charge.
We can choose a couple of different price levels, and work out an estimate of what your revenue would be at each of those different price points:

Some of these price points might be ones you've already tested, but the beauty of this analysis is that it also lets us answer what-if questions about price points we haven't tested.
And there you have it. You've just carried out a basic what-if analysis, which looks at how changes in one thing (the price of bread) affect another (your revenue).
If you've seen examples of what-if analyses before, they might look far more complex than this. In reality though, what-if analyses all follow the same basic procedure:
- Ask a question about how a change in A would affect B
- Understand how A and B are related; usually this is done by creating an equation which relates the two.
- Calculate or visualise the values of B for all the different values of A that you're interested in.
What Are the Benefits of What-If Scenario Analysis?
The benefits of what-if analysis extend far beyond bread making. What-if analysis helps answer questions about all sorts of business decisions:
- Should I open a new premise?
- Should I change my pricing structure?
- Should I run a marketing campaign?
Note that the questions above come from a broad range of different business areas. If you're involved in making business decisions, no matter your focus, you can benefit from building what-if scenario analyses.
How Do You Build What-If Scenarios?
Let's look at how to build what-if scenario analyses in two different tools; Excel and Causal.
Building a what-if scenario analysis in Excel
Excel features a section of 'what-if' tools, to help users understand questions like those posed in the sections above.
The most commonly used amongst these tools is what Excel calls Scenario Manager.
To use scenario manager, you first need to build up a model. This isn't as difficult as it might sound, a model is simply a set of inputs, with an output that's a function of those inputs.
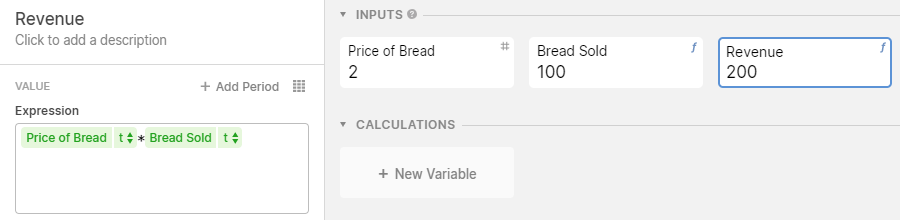
For example, we might create a model with the inputs Price of Bread and Bread Sold, and the output as Revenue:
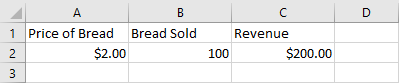
Price of Bread can be whatever you want it to be, Bread Sold should be a function of Price of Bread, and revenue should be the last two numbers multiplied together.
Once you've done this, you can go ahead and open up Scenario Manager, and build your scenarios by clicking 'Add...'
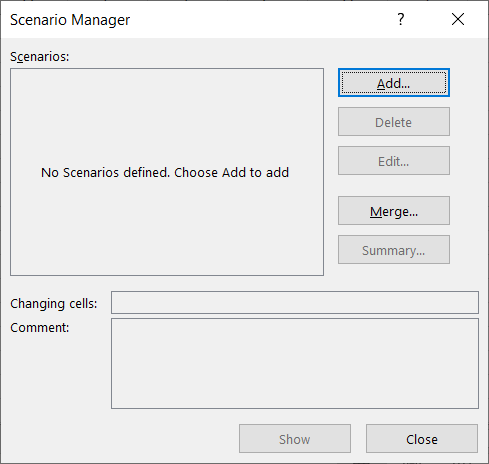
When you're creating each of your scenarios, you'll want to:
- Give it a name, that describes the nature of the scenario.
- Define what the Changing Cells are, i.e. the cells whose values change between scenarios.
- Define the value(s) of your changing cell(s); i.e. what value they should take in this particular scenario.
As an example, we've created two scenarios in which bread is sold for different prices:
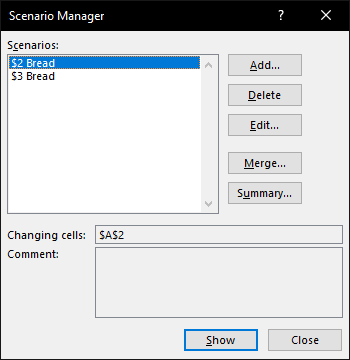
Once you've created your scenarios, you can hit 'Show' to see how the output of your model (revenue) differs between the scenarios you've defined:
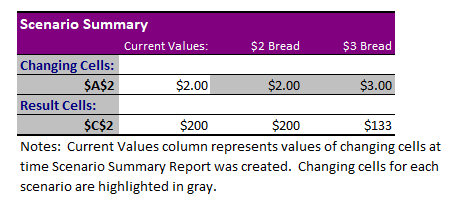
Excel is effectively telling us how our revenue differs in the two different bread price scenarios we looked at, $2 and $3. We can see here that our revenue is higher in the $2 scenario, and we can use that insight to inform our pricing strategy.
Excel's scenario manager is a good tool for analysing models that are already built in Excel, but it has one large downside. If you're creating complex models and moving cells around, this can often break your scenarios. This happens because scenario manager's Changing Cells are fixed, and won't respond to changes in your model.
Building a what-if scenario analysis in Causal
If the above felt a little clunky then don't worry, what-if scenarios are much easier to build in Causal.
We'll start by building our model. In Causal, models are built up of variables. Let's begin by creating a variable for the Price of Bread, and give it a value of $2:
We'll then create another variable for the amount of Bread Sold. To do this, we're going to use an arbitrary equation whose output decreases with the price of the bread:
We chose the equation just so that it would match some of the data-points earlier in the post, and decrease quickly as you rose the price of bread.
Then, to finish our model, we can create a variable called Revenue which is the product of the two existing variables:
Now that we've got our model, we can start to create our what-if analysis.
Causal lets you build scenarios, and change whichever variables you want in each scenario. As an example, I've created a $3 Bread scenario and changed the Price of Bread variable within that scenario to $3.
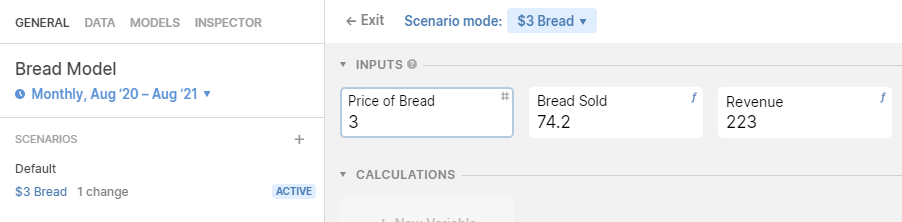
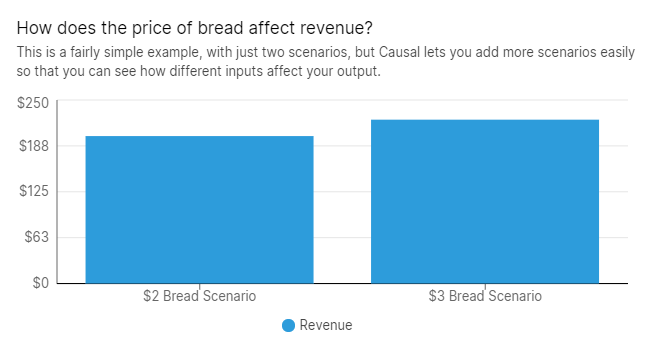
To understand the differences between our scenarios, we can create visualisations such as tables or bar charts to understand how our output (Revenue) changes depending on inputs (Price of Bread):
What-If Analysis in Causal vs Excel
We've looked at two different methods above, so now it's time to ask: should you use Causal or Excel for what-if analyses?
While Excel is a commonly used tool in most professions, Causal has a number of advantages over it:
- Causal models are not only easy to share, but they're also interactive. People viewing your models can change your inputs and scenarios, and see how their changes affect the model.
- Causal models are built around variables, rather than rows and columns. We naturally tend to think in terms of variables, making Causal quick to learn and easy to use.
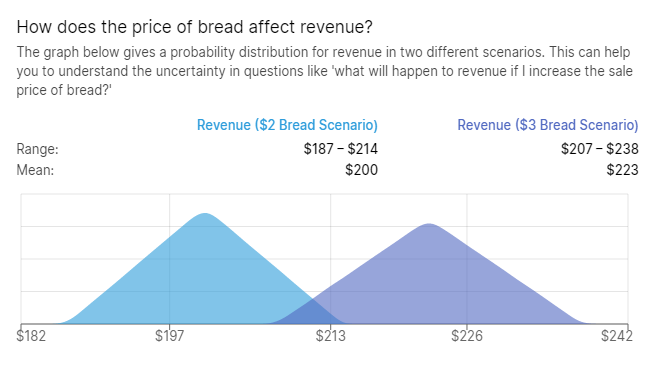
- Causal can easily account for uncertainty. Perhaps we aren't fully certain about how sales are affected by the price of bread; Causal can handle this by allowing you to build uncertainty into your variables:
An interactive demo
Interested in giving Causal a go? Have a play around with the demo model below, then hit Use this template to see how it's built.

.svg)
.svg)