
.png)
The future is far from certain, and this can often make forecasts and projections difficult to build.
When you don't know how much your company's revenue is going to grow by, or whether you're going to start hiring again, it can be difficult to build accurate financial projections.
Dealing with this type of uncertainty is where scenario analysis comes in.
What is scenario analysis?
Scenario analysis is a forecasting technique which involves producing multiple variants of a forecast, where each variant differs in some crucial assumption(s).
For instance, let's say you're putting together a financial model for a business over the next five years. One of the key aspects of such a financial model, and one of the most difficult parts to get right, is forecasting the company's revenue growth.
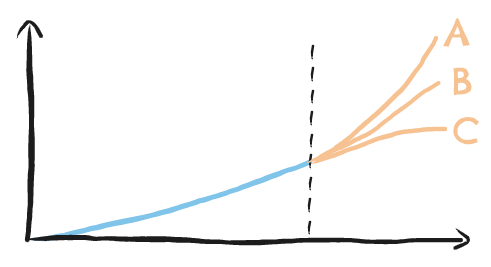
To cope with this challenge, you might use scenario analysis to produce models for several different levels of revenue growth. A common way of doing this is to produce high, medium, and low scenarios.
In the context of revenue growth, you might assume 15% yearly growth for your high scenario, 10% for your medium scenario, and 5% for your low scenario.
By extrapolating these different values of revenue growth out into the rest of your model, you'll end up with a model with three different scenarios. These scenarios can then be used to understand how different levels of revenue growth will affect your company's future finances.
Where is scenario analysis used?
Scenario analysis is commonly used in financial forecasting, to help stakeholders understand how different values of a variable (e.g. revenue growth, from our example above) will affect a wider model.
Some other examples of how scenario analysis crops up in finance are:
- Portfolio modelling
Asset managers will often want to understand how a portfolio will be affected by certain outside factors, like changes in interest rates. Scenario analysis lets them plot out their portfolio's value over the next however many years, under a range of different scenarios. - Risk management
A trader might want to understand the risk involved in a particular trade, by plotting out returns under a variety of different circumstance. Scenario analysis lets them see how much risk they're exposed to, by understanding how high their losses could rise under a set of predefined scenarios.
While scenario analysis finds a natural home in finance, its uses can be found much further afield.
One common place where we often see scenario analysis employed is in climate analysis. Most of us have seen graphs which show how global temperatures will rise if carbon emissions continue to grow at current rates, displayed alongside different scenarios in which we manage to cut carbon emissions by different amounts.
This is a classic example of scenario analysis in the real world. The scenarios each assume different values of some input variable (carbon emission growth) and help us understand how that affects an output variable (temperature rise).
How do you build a scenario analysis?
If you're reading this article, then chances are that you're familiar with spreadsheet apps like Excel or Google Sheets.
Whilst it's true that you can build scenario analyses in a spreadsheet app, doing so can be quite and ordeal. To see why, let's run through an example.
Building scenario analyses in spreadsheets
The most brute-force way of building scenario analyses in something like Google Sheets is to:
- Build out your model.
- Duplicate it once for every alternative scenario you'd like to consider.
- In each duplicated model, change the relevant input variable to reflect the scenario you'd like to show.
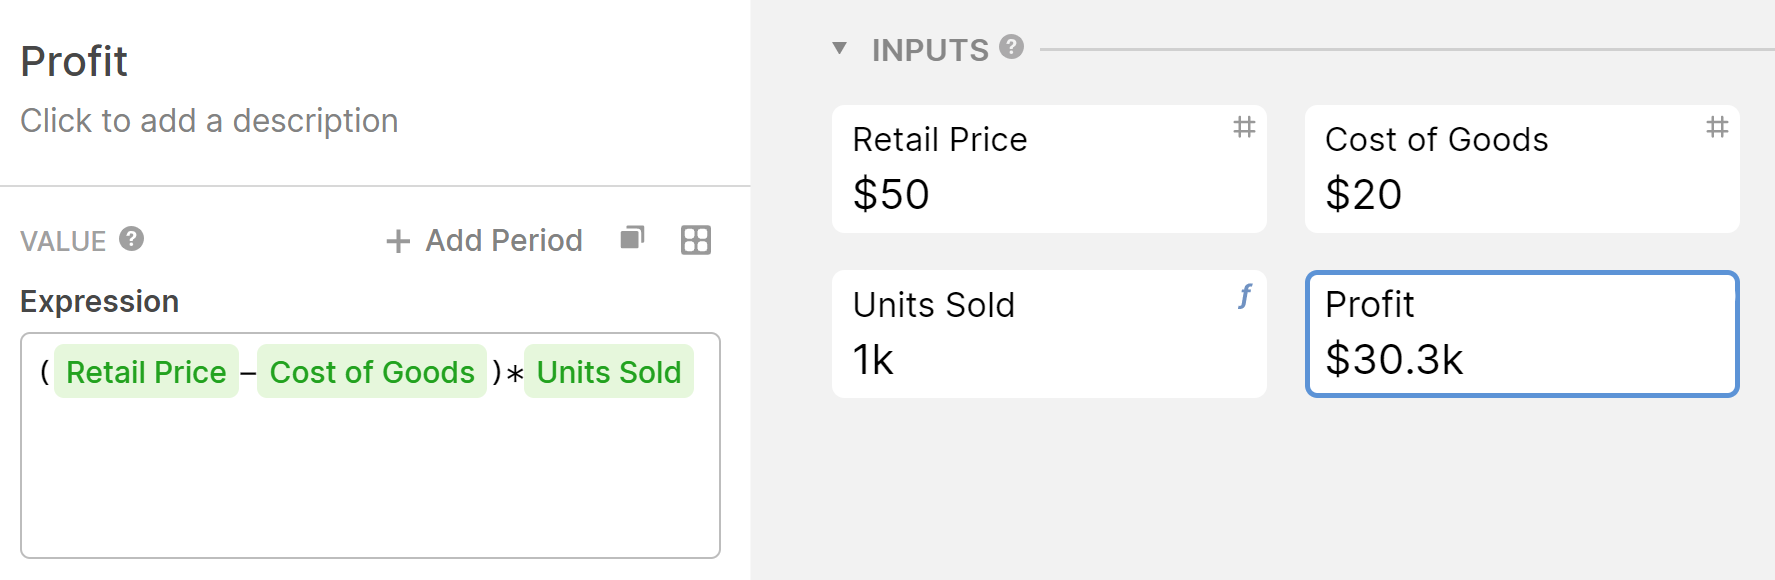
So for example, let's say you build a simple model to show how much profit you expect your business to make by selling a particular product. It might look something like:
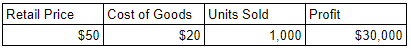
I'm here assuming that we have a formula which relates Retail Price to Units Sold.
Let's say we want to consider 3 scenarios for Retail Price; high, medium, and low scenarios.
If we're happy to treat a $50 Retail Price as our medium scenario, then we duplicate the model twice and input different values for Retail Price in the two new scenarios:
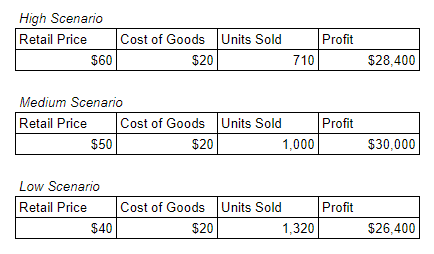
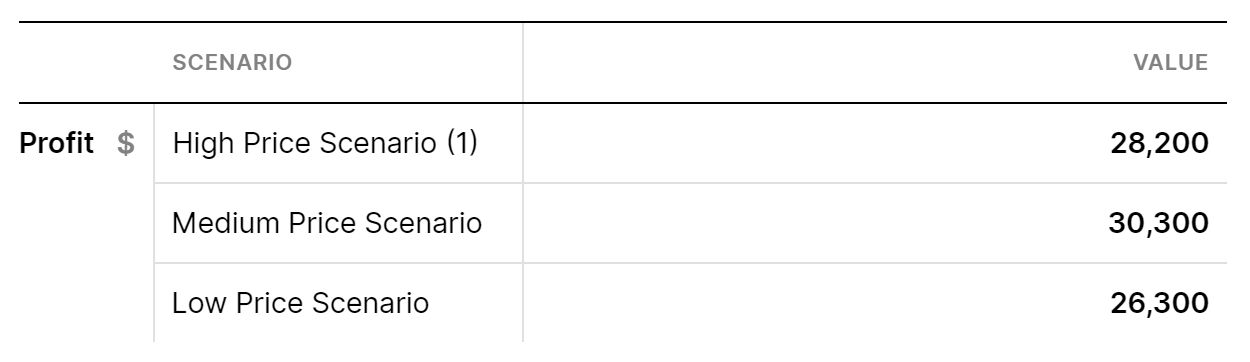
Here we can see how our Profit differs in each scenario, with the most noteworthy result being that our profit is highest in the medium scenario. We can take this learning away to inform our pricing strategy.
Now this method of preparing scenario analyses is all well and good, but it falls down when things start to become more complex.
When your model is more complex than the (very simple) model shown above, duplicating your model can start to become unwieldly.
Consider the model below, where metrics have been duplicated twice to give three different scenarios.
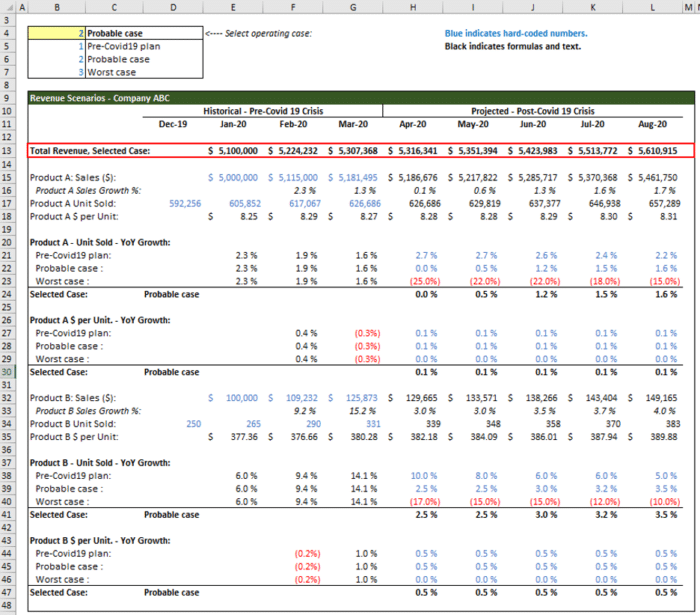
If the modeller wants to add an additional scenario, they have to carefully add additional rows at certain points in the model, making sure not to break any of the existing formulae.
And if they want to change how any part of the model works, they have to do that three times over (once for each scenario).
Clearly this method of scenario analysis is resource consuming; not just in terms of setup, but also in terms of ongoing maintenance whenever any changes need to be made.
Fortunately, there are easier ways to produce scenario analyses.
Building scenario analyses in Causal
Causal is a tool that lets you easily build complex models and scenario analyses.
Unlike a spreadsheet tool, Causal is built around variables. We can start building a model by constructing some of our input variables.
Borrowing from our example earlier, these input variables might be Retail Price and Cost of Goods:

We can then construct other variables using formulae:
If we want to add scenarios to our model, we don't have to build it multiple times over like we did in Google Sheets. Instead, we simply enable scenarios, and create two additional scenarios (which we'll here call high price scenario and low price scenario):
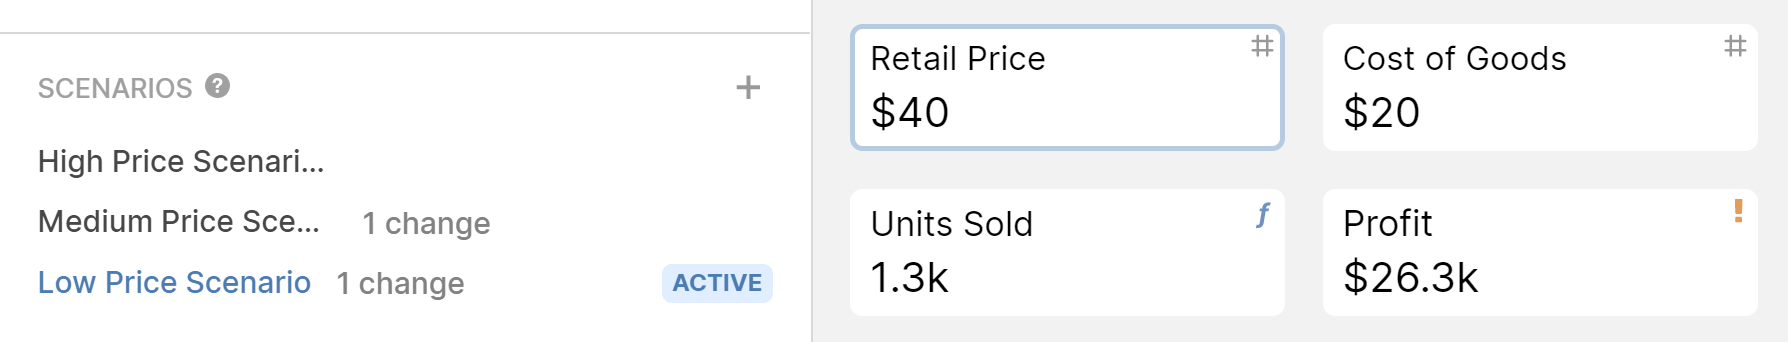
Rather than rebuild the whole model, we simply go into each scenario and change the variable value (Retail Price) that's relevant to that scenario.
Once this is done, we can use charts or tables to visualise the effect that each scenario's Retail Price has on Profit:
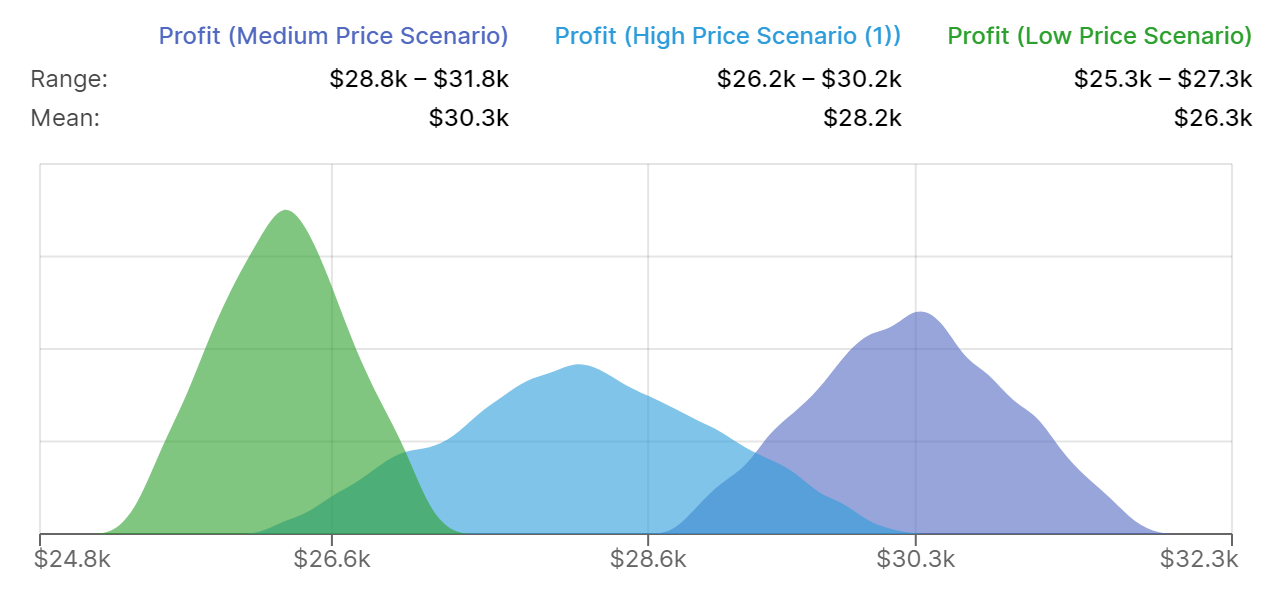
Causal even lets you take this one step further, by factoring in uncertainty too. Let's say you don't know the precise relationship between retail price and units sold.
You can account for this by introducing uncertainty into your formulae:
Which will then allow you to produce charts which can visualise the uncertainty across different scenarios:
If you're looking to build a scenario analysis of your own, Causal is free to get started with. Just click the link in the section below to learn more.

.svg)
.svg)